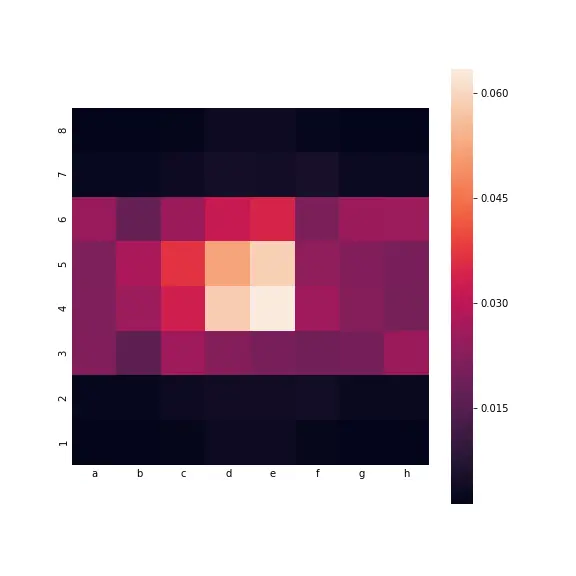
This is a heat map visualising the frequency that each square on a chessboard was played based on data from over 20,000 games collected from users on the site Lichess.org. The dataset is available on
Kaggle.
Each game in the dataset has a list of moves sequentially played by white and black pieces. The move data is written in chess algebraic notation, so has characters to denote which piece is being moved (e.g. Nxb7 means Knight [N] to square b7, capturing an opponent's piece [x]), as well as special characters (e.g. O-O means King castling with the King-side Rook).
So, the first step was to remove the extraneous information to extract only the square being played. Then calculating the proportion of each square as a proportion of the total moves played. Finally, creating a pandas data frame of frequencies and axes labels before using the
seaborn library to generate a heat map.
Unsurprisingly, the most commonly played tiles are the ones in the centre, associated with moving pawns two places forward at the beginning of the game, with e4 being played the most (6.35%).
On the flip side, the corner squares are played the least often. This is likely because, in most games, these corner squares remain occupied by Rooks until the mid- to late-game so they simply aren’t as accessible to other pieces, with a8 and a1 being played the least (0.13%).